This page is setup to share data analysis this author tracks. None of this data is customer based and/or proprietary and doesn’t have any direct connection with business, projects or programs affiliated with our consulting. For example, the Covid Hospitalization Rates data shown below is very interesting data to observe and track, but has nothing to do with designing an embedded hardware solution. Proper sources will be shared for any data shared here on this page.
Covid Hospitalization Rates
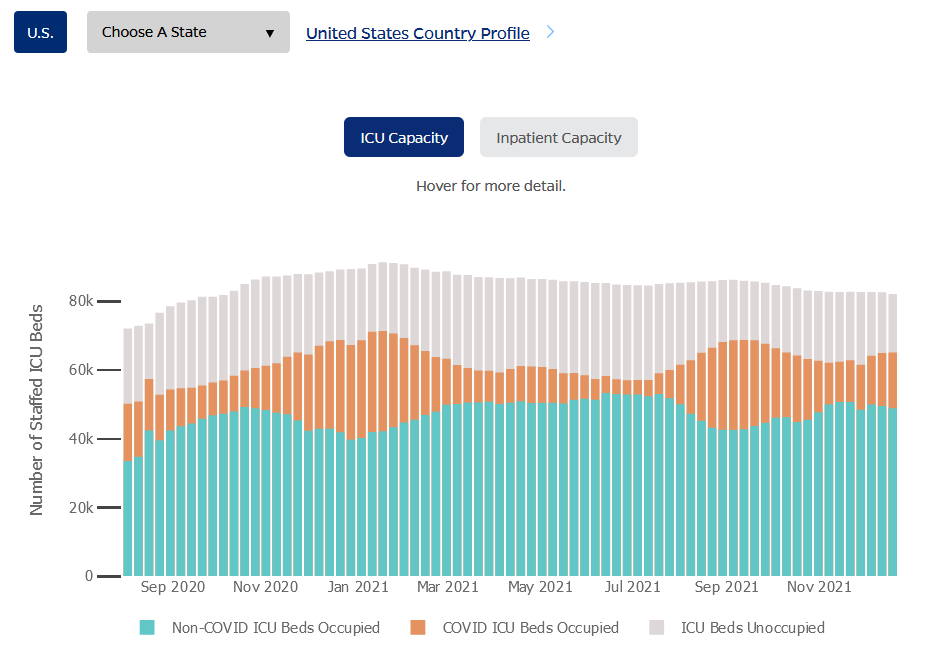
Over the course of the pandemic, a lot of information and data has been presented, monitored, tracked, analyzed, etc. Of all the data available, such as New Cases, Death Rates, etc, the most informative (again, to this author) is the Covid Hospitalization Rates. This data lags News Cases by several weeks but shows how severe a particular wave really is. Many times, we hear about new cases or death cases only to learn the data is challenged because it may or may not have other factors which contribute. This Hospital Rate data, provided by John Hopkins University of Medicine, and can be found here, simply shows ICU Bed Count information and whether or not the bed is considered a Covid Bed or Non-Covid Bed.
Here is a website image snapshot of the John Hopkins site, where the below spreadsheet data is pulled. Below it, is a spreadsheet of the same data with a few more calculations that might be interesting to some.
Some Other Calculations of the Covid Hospitalization Rates Data
Along with the provided data shown in the John Hopkins 7-Day Trend chart, a few other calculations are done in the spreadsheet, including:
- Total Occupied: shows total # of ICU Beds occupied, regardless of whether its Covid related or not.
- Max Total Beds: calculated maximum value of Total Beds Available, based on the data-set.
- Float: shows the Delta between the Max Total Beds in the data sample AND the Total Beds for that week. This is interesting data because it shows a possible way in which hospitals use capacity efficiently. It suggests that as more cases of Covid occur, more beds are deemed ICU Beds so that there is capacity to cover without maxing out. This author does not know this to be true, its just an assumption based on the data.
Spreadsheet Below Last Uploaded: Friday, December 17th, 2021
Many apologies for the data-view shown above. Its a limitation of the WordPress Plug-In being used. There should be download link if you interested to see more. Also, the above if for the United States in total. State data is available at the source site listed above and may be shared here soon. (starting w/ Texas).